- Cluster Analysis
is (yet another) a data mining problem
- Cluster Analysis
divides the data
into groups (clusters)
that are
meaningful
(usually based on some
similarity criteria)
- Important fact:
- Cluster Analysis
groups the data objects
based only
on information
found in the data itself.
- The cluster analysis
study the data object and its
relationship
with other data objects
- It uses a
distance function
to classify
how close/far
two data objects are
related to each other
- The algorithms operates
without the interaction
with humans
For this reason, cluster analysis is often called unsupervised classification methods
- Cluster Analysis
groups the data objects
based only
on information
found in the data itself.
- Consider 2 properties
of materials.
The following is a graphical representations of the property values:
- Forming 2 clusters:
- Forming 4 clusters:
- K-means and
K-medians
- User specifies a given
number of clusters
- The algorithm finds centroids (center points) that minimizes the total distance between the centroids and the points in the same cluster as the centroid point
- User specifies a given
number of clusters
- Hierarchical Clustering
- Algorithm starts with
each data point
being a singleton cluster
- Repeatedly merge the two closest clusters
- Algorithm starts with
each data point
being a singleton cluster
- DBScan
- Clustering algorithm uses
density
as the clustering measure
- Number of clusters
is determined automatically
by algorithm
- Point in low density regions are classified as noise and omitted
- Clustering algorithm uses
density
as the clustering measure
- This course is not about
data mining.
I will only discuss K-means (K-medians) and Hierarchical clustering because the stream clustering algorithm - by Guha et. al. - is an extension of these algorithms.
- The data items usually have
multiple attribute (property) values
Example: Food
- Weight index (per volume)
- Protein value
- Vitamin values
- and so on..
Sample data:
- Beef: weight = 10 g/cm3, protein = 5 g/cm3, ...
- Carrot: weight = 6 g/cm3, protein = 0.001 g/cm3, ...
- In general:
- The attributes (properties)
considered in the clustering are:
A1,
A2, ...,
An
- I will use lower case letters
to denote the value of the properties
of a given item, e.g.:
- Item X's property values: (x1, x2, ..., xn)
- Item Y's property values: (y1, y2, ..., yn)
- The attributes (properties)
considered in the clustering are:
A1,
A2, ...,
An
- How similar (close)
or different (far)
two objects are is defined by
a distance function
on the clustering attributes
- Commonly used distance functions:
- Euclidean distance (2-norm):
- The distance between
two different items X and
Y is given by:
                    --------------------------------------------
     Dist(X,Y) =  \/ (x1 - y1)2 + (x2 - y2)2 + ... + (xn - yn)2

 Graphically in 2-dimension:


        X
	|\
	| \
	|  \      --------------------------
	|   \   \/ (x1 - y1)2 + (x2 - y2)2
	|    \
	|     \
	+----->
	       Y
The resulting algorithm is called the K-means method
- The distance between
two different items X and
Y is given by:
- Manhantan distance (1-norm):
- The distance between
two different items X and
Y is given by:
     Dist(X,Y) =  |(x1 - y1)| + |x2 - y2)| + ... + |xn - yn|

 Graphically in 2-dimension:

         |(x1 - y1)|
        X ---------->
                    |
		    |
		    | |x2 - y2)|
		    |
		    |
		    V
		    Y
The resulting algorithm is called the K-medians method
- The distance between
two different items X and
Y is given by:
- Cosine (angle between the vectors):
- The distance between
two different items X and
Y is given by:
     Dist(X,Y) = arccos ( (x1, x1, ..., x1) ⊗ (y1, y1, ..., y1) / (|X||Y|) )

     ⊗ = the inner product operator
     |X| = sqrt( x12 + x22 + ... + xn2 )
     |Y| = sqrt( y12 + y22 + ... + yn2 )
Graphically:
This measure is commonly used to measure difference in text documents
- The distance between
two different items X and
Y is given by:
- Euclidean distance (2-norm):
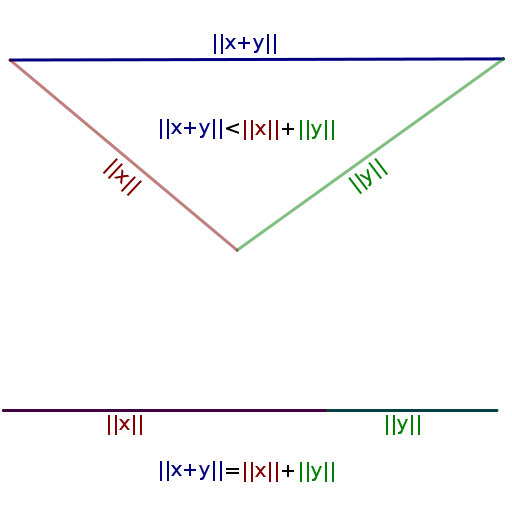
- The triangular inequality
is applicable to
many distance functions:
- 1-norm:
- x = (x1, x2, ..., xn)
- y =
(y1, y2, ..., yn)
- Triangular inequality holds:
- |x1 − y1| + |x2 − y2| + ... + |xn − yn| ≤ (|x1| + |x2| + ... + |xn|) + (|y1| + |y2| + ... + |yn|)
- And of course for the Euclidean norm:
- x = (x1, x2, ..., xn)
- y =
(y1, y2, ..., yn)
- Triangular inequality holds:
- (x1 − y1)2 + (x2 − y2)2 + ... + (xn − yn)2 ≤ ((x1)2 + (x2)2 + ... + (xn)2) + ((y1)2 + (y2)2 + ... + (yn)2)
- Problem Description:
Given the following properties of 4 medicines:
                  Weight index        pH value

   Medicine A         1                  1
   Medicine B	      2			 1
   Medicine C	      4			 3
   Medicine D	      5			 4
Graphical representation:
Problem:
- Put the data points in 2 clusters (groups)
(Easy examples make things easier to understand :-))
- Step 0: Pick initial centroids
(picking good starting point is an art...)
- Step 1: Find nearest centroid
using Euclidean distance
- Step 2: Recompute centroid
for each group
New centroid (c1, c2, ..., cn) for the cluster C is found through:
- c1 = ∑Xj ∈ C ( xj1 ) / |C|
- c2 = ∑Xj ∈ C ( xj2 ) / |C|
- And so on...
Example:
- c1 = (2 + 4 + 5)/3 = 3.666
- c2 = (1 + 3 + 4)/3 = 2.666
Result:
- Repeat Step 1:
Find nearest centroid
using Euclidean distance
- Repeat step 2:
Recompute centroid
for each group
- Repeat Step 1:
Find nearest centroid
using Euclidean distance
- Repeat step 2:
Recompute centroid
for each group
- NO CHANGES
DONE
- When using K-medians algorithm,
step 1 is
modified to:
- Find nearest centroid
using Manhattan distance
Example:
- Find nearest centroid
using Manhattan distance
- Step 2 (recompute centroid
for each group)
is unchanged !!!
The new centroid (c1, c2, ..., cn) for the cluster C is found through:
- c1 = ∑X ∈ C ( x1 ) / |C|
- c2 = ∑X ∈ C ( x2 ) / |C|
- And so on...
- Algorithm:
   Select K points as initial centroids;

   repeat
   {
      Form K clusters by assigning each point to its neareast centroid;
      Recompute the centroid using the new membership of each cluster;

   } until (centroids do not change)
- We can look at the clustering algorithm
as a minimalization problem
- The cost of the
minimalization problem is:
-
minimize:
∑k=1..K
(
∑x ∈ Clusterk
Dist(x, centroidk)
)
-
minimize:
∑k=1..K
(
∑x ∈ Clusterk
Dist(x, centroidk)
)
- The cost of
a sloution is thus defined as:
-
Cost(solution) =
∑k=1..K
(
∑x ∈ Clusterk
Dist(x, centroidk)
)
-
Cost(solution) =
∑k=1..K
(
∑x ∈ Clusterk
Dist(x, centroidk)
)
- Methods:
- Random...
- Advantage::
Easy to do
- Disadvantage: different runs of the K-means algorithm can produce different clusters !!!
- Advantage::
Easy to do
- Farthest points:
- Select the first centroid
randomly
- Select the point farthest
from centroid
as the second centroid
- Select the point farthest
from both centroids
as the third centroid
- And so on.
Finding farthest points is pretty computationally intensive
- Random...
- Space requirement:
- You need to store attribute values
from:
- The data points
- The centroid points (the centroids may not be equal be any data point !)
- Space requirement: O((m+K) n)
- m = number of data points
- K = number of centroid points
- n = number of attributes
- You need to store attribute values
from:
- Time requirement:
- In each loop:
- Find distance of
all attributes of
each data point
to each centroid point:
- O(K×m×n)
- Find distance of
all attributes of
each data point
to each centroid point:
- Total running time:
- O(I×K×m×n)
- I = number of iterations until convergence
- In each loop:
- A second important class
of clustering algorithms
is the
Hierarchical Agglomerative
algorithms
- Basic Hierarchical Agglomerative Algorithm:
   for ( each x ∈ input set )
   {
      Cx = { x };    // Each data point is in its own cluster
   }

   Compute the Proximity Matrix between every 2 cluster

   repeat
   {
      Merge the closest 2 clusters;

      Update Proximity Matrix;

   } stop condition (e.g., min. distance > MIN or number clusters = k, etc., etc)
- The key operation
of the HAC algorithm is
computing the proximity
between clusters
- Commonly used cluster distance measures:
- Minimum distance:
- Maximum distance:
- Average distance:
- Ward's method:
cluster is represented
by its centroid
- Minimum distance:
- Initilial state:
- After one merge operation:
- After two merge operations: