Suppose a TCP receiver receives 60 M Bytes of data in 1 min, then:
$ns trace-queue $src_node $dest_node $output_file |
This will instruct NS to write packet arriving activities on the link ($src_node, $dest_node) to the output file $output_file
set n0 [$ns node] set n1 [$ns node] $ns duplex-link $n0 $n1 2Mb 10ms DropTail set trace_file [open "out.tr" w] $ns trace-queue $n0 $n1 $trace_file |
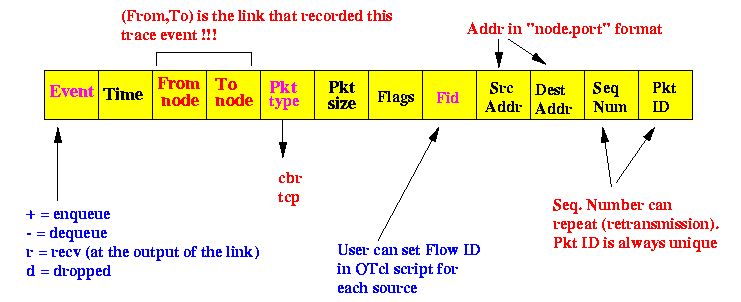
+ 0.311227 3 4 tcp 592 ------- 0 0.0 4.0 0 0 - 0.311227 3 4 tcp 592 ------- 0 0.0 4.0 0 0 r 0.351867 3 4 tcp 592 ------- 0 0.0 4.0 0 0 |
|
#Make a NS simulator set ns [new Simulator] # Define a 'finish' procedure proc finish {} { exit 0 } # Create the nodes: set n0 [$ns node] set n1 [$ns node] set n2 [$ns node] set n3 [$ns node] set n4 [$ns node] set n5 [$ns node] # Create the links: $ns duplex-link $n0 $n2 2Mb 10ms DropTail $ns duplex-link $n1 $n2 2Mb 10ms DropTail $ns duplex-link $n2 $n3 0.3Mb 200ms DropTail $ns duplex-link $n3 $n4 0.5Mb 40ms DropTail $ns duplex-link $n3 $n5 0.5Mb 30ms DropTail # Add a TCP sending module to node n0 set tcp1 [new Agent/TCP/Reno] $ns attach-agent $n0 $tcp1 # Add a TCP receiving module to node n4 set sink1 [new Agent/TCPSink] $ns attach-agent $n4 $sink1 # Direct traffic from "tcp1" to "sink1" $ns connect $tcp1 $sink1 # Setup a FTP traffic generator on "tcp1" set ftp1 [new Application/FTP] $ftp1 attach-agent $tcp1 $ftp1 set type_ FTP (no necessary) # Schedule start/stop times $ns at 0.1 "$ftp1 start" $ns at 100.0 "$ftp1 stop" # Set simulation end time $ns at 125.0 "finish" (Will invoke "exit 0") ################################################## ## Obtain Trace date at destination (n4) ################################################## set trace_file [open "out.tr" w] $ns trace-queue $n3 $n4 $trace_file # Run simulation !!!! $ns run |
Run progran with NS and you will get a trace file
|
These are the packets that are received by TCP entity "4.0" in the first second:
|
The total number of bytes received in the first second is therefore:
or:
So the throughput in the first second is 9792 bits/sec = 0.009792 Mbps
Repeat the process for the second second, and so on...
You do NOT want to do that by hand...
Save it and run as using:
perl throughput.pl trfile destNode srcNode.port# destNode.port# \ time-granularity |
Time-granularity let you compute the throughput over time intervals, each interval will have the size given by the time-granularity
You can use the following command to get average throughput data from the trace file obtained in the NS script above:
perl throughput.pl out.tr 4 0.0 4.0 1 > out |
We need to use these parameters to extract the throughput data because of:
r 0.351867 3 4 tcp 592 ------- 0 0.0 4.0 0 0 |
To plot the progressing of average throughput, use gnuplot:
gnuplot >> plot "out" using 1:2 title "TCP throughput" with lines 1 |
|
Therefore, the throughput between 3 and 4 second is:
54 x 592 bytes = 31968 bytes /sec = 255744 bits/sec = 0.255744 Mbps |
Only packets with sequence numbers 32 to 49 (18 packets) are counted as "good" throughput.
Therefore, the goodput between 3 and 4 second is:
18 x 592 bytes = 10656 bytes/sec = 85248 bits/sec = 0.085248 Mbps |
 
  |
In the class TraceApp we need to write a method recv(x) - the parameter x is the number of bytes in the data segment.
// Define "TraceApp" as a child class of "Application" Class TraceApp -superclass Application // Define (override) "init" method to create "TraceApp" object TraceApp instproc init {args} { $self set bytes_ 0 eval $self next $args } // Define (override) "recv" method for "TraceApp" object TraceApp instproc recv {byte} { $self instvar bytes_ set bytes_ [expr $bytes_ + $byte] return $bytes_ } |
(You can view this method as the constructor)
The init{args} method set the variable bytes_ to 0 (this variable is used to tally the number of bytes received)
(In fact, the recv{byte} method is defined in the parent class Application - by defining a new recv{byte} method in the child class TraceApp, we have overridden the one in the parent class Application)
The most important statement in recv{byte} is:
set bytes_ [expr $bytes_ + $byte] |
NOTE:
You work with the TraceApp just the way you used
the Application/FTP
application.
So, to use TraceApp:
|
set sink1 [new Agent/TCPSink] ;# Create a TCPSink object set traceapp [new TraceApp] ;# Create a TraceApp object $traceapp attach-agent $sink1 ;# Attach traceapp to TCPSink $ns at 0.0 "$traceapp start" ;# Start the traceapp object |
plotThroughput {tcpSink outfile} { global ns set now [$ns now] ;# Read current time set nbytes [$tcpSink set bytes_] ;# Read number of bytes $tcpSink set bytes_ 0 ;# Reset for next epoch set time_incr 1.0 ### Prints "TIME throughput" in Mb/sec units to output file set throughput [expr ($nbytes * 8.0 / 1000000) / $time_incr] puts $outfile "$now $throughput" ### Schedule yourself: $ns at [expr $now+$time_incr] "plotThroughput $tcpSink $outfile" } |
When you run the program, it will create an output file "out2.tput" that contain goodput data which you can plot using gnuplot: