- Do NOT think that this is the end of the story about
Congestion Control on the Internet !
- This material on TCP is only the tip of the iceberg...
There are much more problems and issues with TCP after they introduced TCP Reno
- For example,
research has discovered that different TCP flows
sharing a bottle neck link will
synchronize
with each other !!!
(Here is a paper that points out the phenomenon: click here )
Example that illustrates TCP synchronization:
- Source 1 (red) start transmitting at time 0.1 sec
- Source 2 (blue) start transmitting at time 20.0 sec

- Here is a NS2 source file to simulate 2 TCP Reno sources
sharing the bottle neck link:
click here
- Right click and save the file in your directory.
- Run program with:
/home/cheung/NS/run-ns Reno.tcl - You should see the Network Animator window when it finish running... click PLAY to see the simulation in action
- You need to run the simulation to see the animation
because I deleted the animation file generated by
the simulation.
- The Congestion Window CWND plot data output files are here:
- Window plot for TCP source 1: click here
- Window plot for TCP source 2: click here
To see the plot of the CWND of TCP, save the Congestion Window CWND plot file in your directory and run gnuplot
In gnuplot, issue the command:
     plot "WinFile" using 1:2 title "Flow 1" with lines 1, \
          "WinFile2" using 1:2 title "Flow 2" with lines 2
You should see this plot:
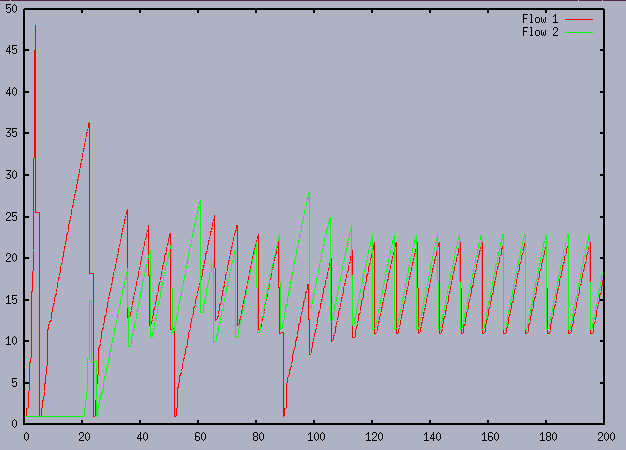
- The plots shows clearly that:
- Flow 1 starts early
- Flow 2 starts later and cause packet drops for both flows
- The 2 TCP flows perform Slow Start
together and reduce their windows
simultaneously
- Eventually, the congestion windows of both flows are synchronized !!!
This kind of behavior is not good, because the best way to utilizate all network capacity is for one of the flow to cut back
(But it should NOT always be the same flow, otherwise you have unfairness)
- The research to solve this phenomenon triggered the development of
"Active Queue Management (AQM)" - among them, the "Random Early
Drop/Detection (RED)" queue is the best well-known representative.
- TCP is
NOT fair
when different TCP connection share a bottle neck link
but have different Round Trip Times (RTT)
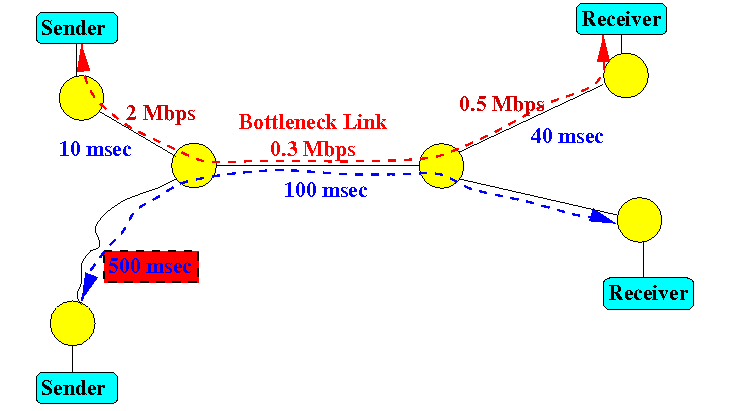
- Example that illustrates TCP unfairness when RTTs differ:
- Source 1 (red) start transmitting at time 0.1 sec, RTT is 2 x 150 msec
- Source 2 (blue) start transmitting at time 20.0 sec,
RTT is 2 x 640 msec
- Due to higher RTT, the CWND of flow 2 will increase slower !!!
- Here is a NS2 source file to simulate 2 TCP Reno sources
sharing the bottle neck link:
click here
- Right click and save the file in your directory.
- Run program with:
/home/cheung/NS/run-ns Reno.tcl - You should see the Network Animator window when it finish running...
click PLAY to see the simulation in action
(The NAM file is too big and I deleted it...)
- The Congestion Window CWND plot data output files are here:
- Window plot for TCP source 1: click here
- Window plot for TCP source 2: click here
To see the plot of the CWND of TCP, save the Congestion Window CWND plot file in your directory and run gnuplot
In gnuplot, issue the command:
     plot "WinFile" using 1:2 title "Flow 1" with lines 1, \
          "WinFile2" using 1:2 title "Flow 2" with lines 2
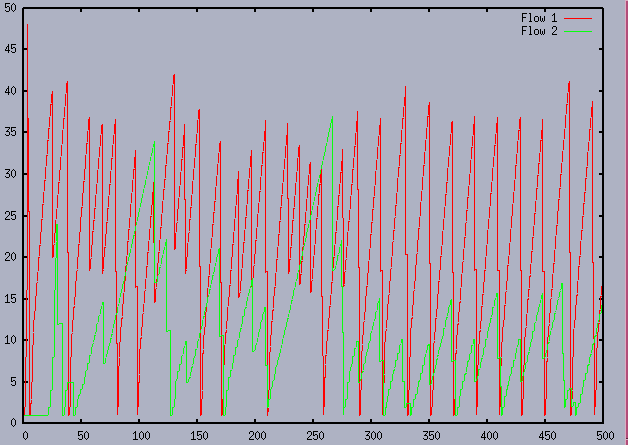
You should see this plot:
- You can see that the average congestion window size of flow 2
is lower than flow 1 and they do not converge...
- BTW, you can also see the
TCP flow synchronization problem in this plot:
-
Both flows will often perform slow start at (approximately)
the same time
- Another area of intense research is to adapt TCP for
higher speed networks (Giga or Tera bit networks).
In these networks, the usable window size is huge... hundreds of thousands of packets.
TCP cannot afford the luxury to increase its window size by 1 in each RTT.
In order to reach the fill capacity of the network, TCP must increase faster...
- Example that illustrates TCP's behavior in high speed network :
- Source start transmitting at time 0.1 sec
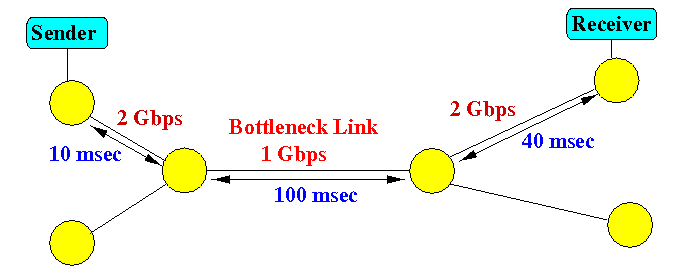
- Here is a NS2 source file to simulate TCP Reno
on a high speed (Giga bit) network:
click here
- Right click and save the file in your directory.
- Run program with:
/home/cheung/NS/run-ns Reno.tcl - You should see the Network Animator window when it finish running...
click PLAY to see the simulation in action
(The NAM file is too big and I deleted it...)
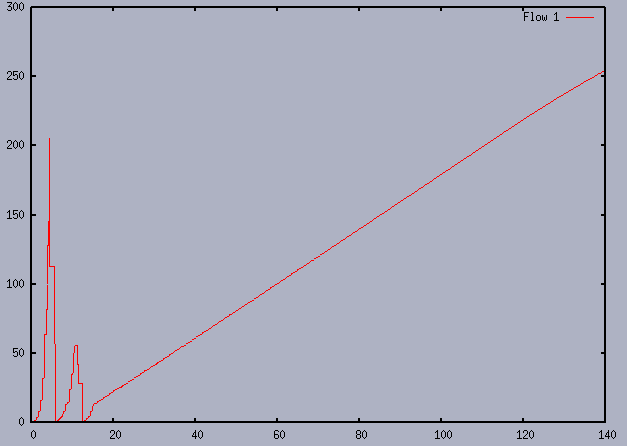
- The Congestion Window CWND plot data output files are here:
- Window plot for TCP: click here
To see the plot of the CWND of TCP, save the Congestion Window CWND plot file in your directory and run gnuplot
In gnuplot, issue the command:
plot "WinFile" using 1:2 title "Flow 1" with lines 1You should see this plot:
- You can see that TCP performed 2 unsuccessful slow starts
- At approximately 16 sec, TCP performs the 3rd slow start.
- This slow start terminates at approximately 18 sec.
- Then TCP performs Congestion Avoidance... all the way up from CWND = 20 (approximately) to 250+ The simulated ended after 140 sec and TCP has not reached full capacity yet !!!
- If TCP wants to take advantage of high speed links,
it must increase the congestion window more aggressively and
additively
- The Internet is a huge internaltional and operational network
- Clearly, you cannot try your "experimental solution" on
such a network - your solution may break the Internet and
cause many people to want to lynch you :-)
- Solutions are first implemented on a simulation platform.
- A commonly used Internet simulation tool is:
NS2
( click here )
- We will next learn how to use NS and learn how to implement new protocols in NS.