- Recall that we must find answer to two questions
to develop a congestion control method:
- How to detect
congestion
- How fast do you change transmission rate when you detect congestion/no congestion
- How to detect
congestion
- When have looked at the first question
- The second question has been studied extensively by Raj Jain and this web page is based on his paper: click here
- Assume you have a way to obtain a binary
congestion indication signal from the network:
- congestion indication = 0 means
no congestion
- congestion indication = 1 means congestion
- congestion indication = 0 means
no congestion
- The next important question in the design of the congestion avoidance
method is:
- How fast
do you decrease the transmission rate
if there is congestion
- How fast do you increase the transmission rate if there is no congestion
- How fast
do you decrease the transmission rate
if there is congestion
-
Some important considerations in the design
of the congestion control method:
- Is the method fair ?
-
Will everyone get a fair share of the available bandwidith ?
- Is the method stable ?
-
Does the method
converge to some state
or does the system state fluctuate erratically (swings wildly) ?
- Other design criteria (including "efficiency" and "distributedness")
- Is the method fair ?
-
Analysis of Increase and Decrease Algorithms for Congestion Avoidance
- Raj Jain has studied the performance of linear
increase/decrease methods in the paper
"Analysis of the Increase and Decrease Algorithms for Congestion Avoidance in Computer Networks" - click here
- Let
x(t)
be the current transmission data rate
- Let x(t+1) be the transmission data rate used after the rate adjustment (made according to the congestion indication)
- Let
x(t)
be the current transmission data rate
- Jain has studied the use of linear increases/decreases
in congestion control
I.e., the change in transmission rate is a linear function
- If
congestion indication = 0 (no congestion), then:
x(t+1) = Aincrease + Bincrease * x(t)
where Aincrease and Bincrease are constant (that will make x(t+1) less than x(t)).
- If
congestion indication = 1 (congestion),
then:
x(t+1) = Adecrease + Bdecrease * x(t)
where Adecrease and Bdecrease are constant (that will make x(t+1) greater than x(t)).
- Raj Jain has studied the performance of linear
increase/decrease methods in the paper
- Additive and Multiplicative Increases/Decrease
- Additive and multiplicative increase/decrease are special cases
of linear increase/decrease function
- Jain has mainly focused on these two congestion control technqiues
in his paper
- Additive increase/decrease:
  x(t+1) = x(t) + Aincrease    (Aincrease > 0)
  x(t+1) = x(t) + Adecrease    (Adecrease < 0)
- Multiplicative increase/decrease:
  x(t+1) = Bincrease * x(t)   (Aincrease > 1)
  x(t+1) = Bdecrease * x(t)   (Adecrease < 1)
- Additive and multiplicative increase/decrease are special cases
of linear increase/decrease function
- The behavior of the congestion control mechanism is revealed clearly
by studying the behavior of only two connections:
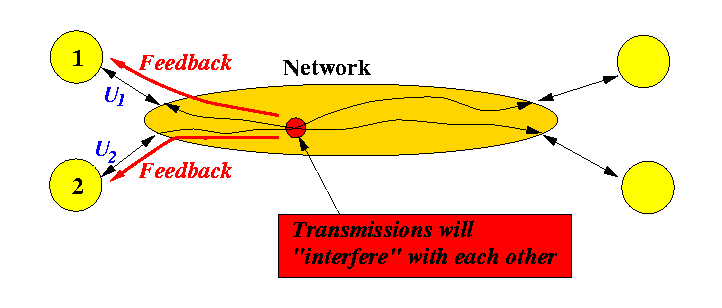
- User 1 transmits with a data rate U1
- User 2 transmits with a data rate U2
- User 1 and user 2 transmissions interfere with each other
in a bottleneck router somewhere within the network.
- Bottleneck router return congestion feedback to
user 1 and user 2.
The router will always report the same feedback
to both users
(Note: if you want the router to return different feedback to different users (e.g., only the one that is transmitting a lot is told to reduce data rate) you will have to make the router very smart - it must tally the traffic from each user. Existing routers do not perform this bookkeeping function - yet....) much If router want
- User 1 transmits with a data rate U1
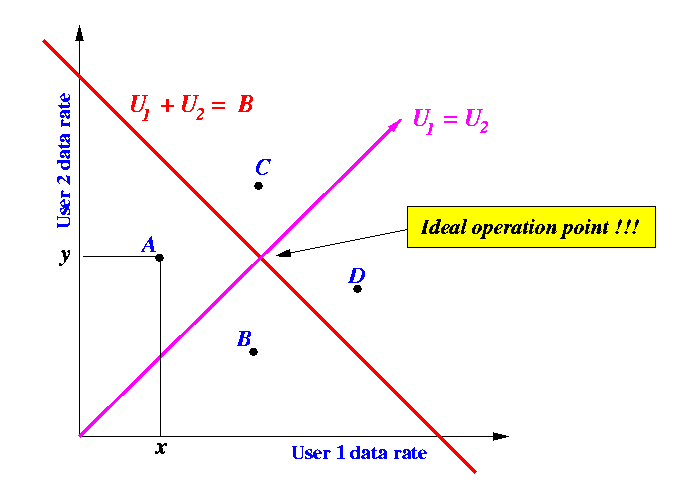
- The performance of a two connection system can be depicted
by the following figure:
- Recall: User 1 transmits with a data rate U1
- Recall: User 2 transmits with a data rate U2
- We can represent these 2 facts by a point in the grid.
- For example, the point A represents the event
that user 1 is transmitting with a data rate
U1 = x
and user 2 is transmitting with a data rate
U2 = y
- The red line represent
the operational points where the sum of the data rates
of user 1 and 2 is equal to the network capacity
B
- The magenta line represent
the operational points where user 1 and 2 transmits with
equal rate (fair!)
- How to interpret the information in the picture:
- Points in the A quadrant
does not cause congestion
(data rate is below capacity of network) and unfair to user 1
(data rate of user 1 is less than that of user 2)
- Points in the B quadrant
does not cause congestion
and unfair to user 2
- Points in the C quadrant
WILL cause CONGESTION
(data rate is higher than the capacity of the network)
and unfair to user 1
- Points in the D quadrant WILL cause CONGESTION and unfair to user 2
- Points in the A quadrant
does not cause congestion
(data rate is below capacity of network) and unfair to user 1
(data rate of user 1 is less than that of user 2)
- Recall: User 1 transmits with a data rate U1
- Effect of the congestion control mechanism:
- When the users are operating in the quadrants
A or B, the users will
receive CONGESTION = 0 signal and they will
both increase their data rate.
- The data rate will eventually exceed B and
the users will then operate in the quadrants
C or D.
The network will generate CONGESTION = 1 signals to the users and they will both decrease their data rate.
- The data rate will eventually drop below B and
the users will again operate in the quadrants
A or B.
The network will now generate CONGESTION = 0 signals to the users and they will both increase their data rate.
- And so on....
- When the users are operating in the quadrants
A or B, the users will
receive CONGESTION = 0 signal and they will
both increase their data rate.
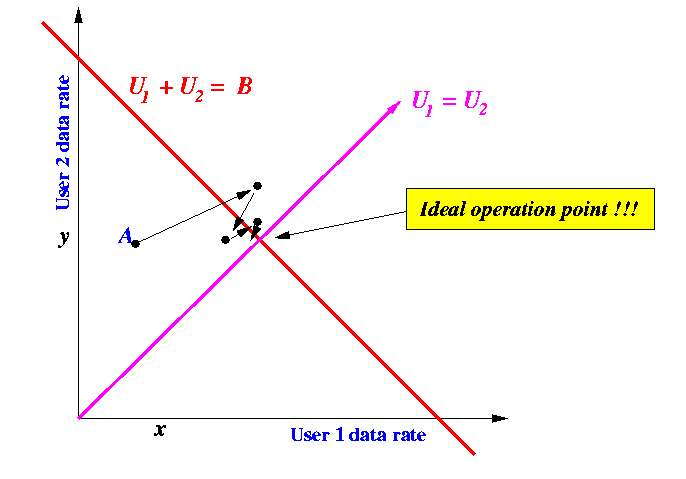
The following figure shows the behavior of the ideal congestion control method:
|
- Starting from any operatinal point, the system moves
towards the ideally fair and maximum throughput point.
- The amplitude of the "swings" decreases monotonically
(this signals stability - if the swings becomes
larger, convergence is not guarantee !)
- The amplitude of the swings should decrease rapidly
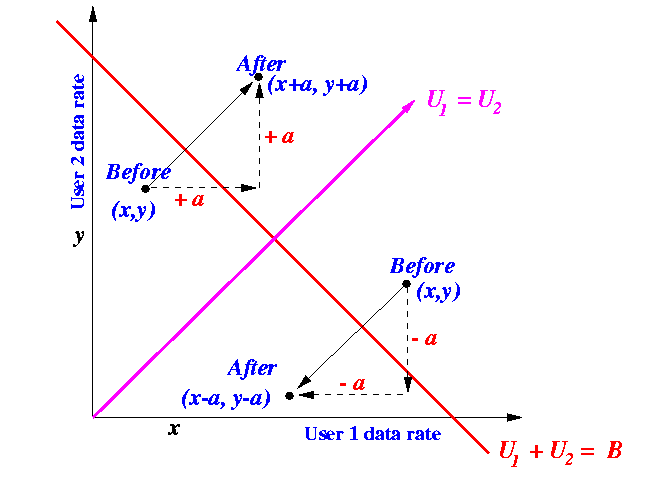
The following figure show the effect when the congestion control uses an additive method to adjust the transmission data rate:
|
The following figure show the effect when the congestion control uses an multiplicative method to adjust the transmission data rate:
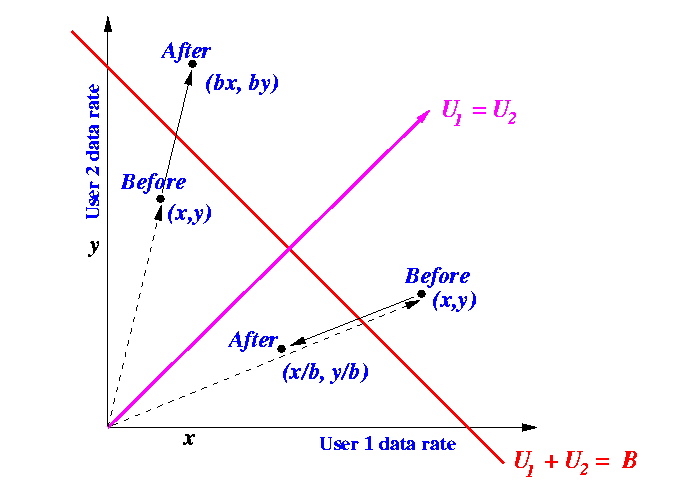
|
The following figure shows the effect of the "additive increase and additive decrease" method:
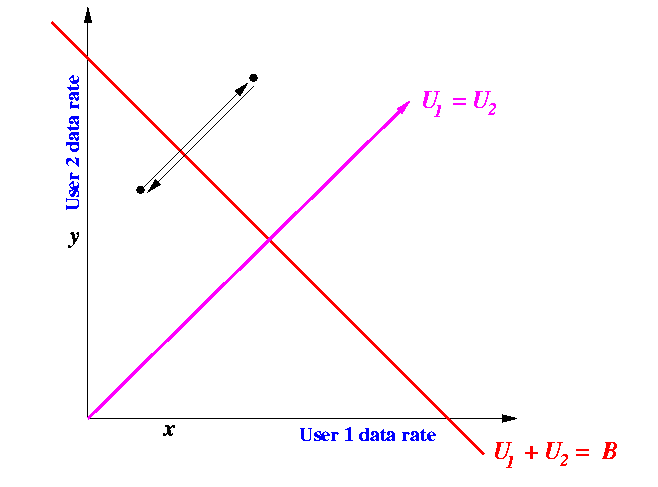
|
- Method does not converge !!!
The following figure shows the effect of the "multiplicative increase and multiplicative decrease" method:
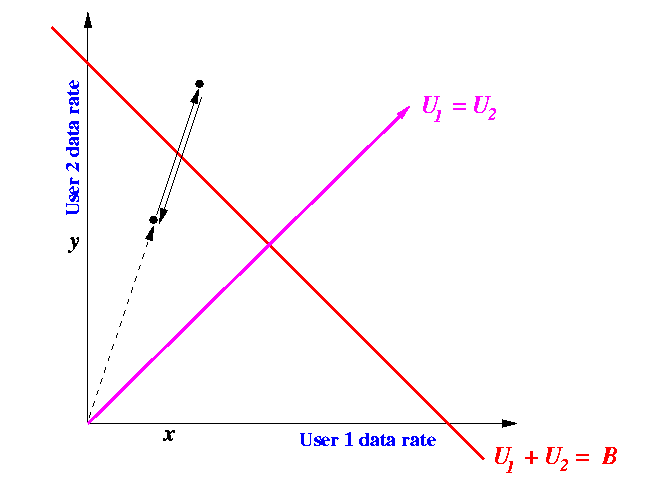
|
- Method does not converge !!!
The following figure shows the effect of the "multiplicative increase and additive decrease" method:
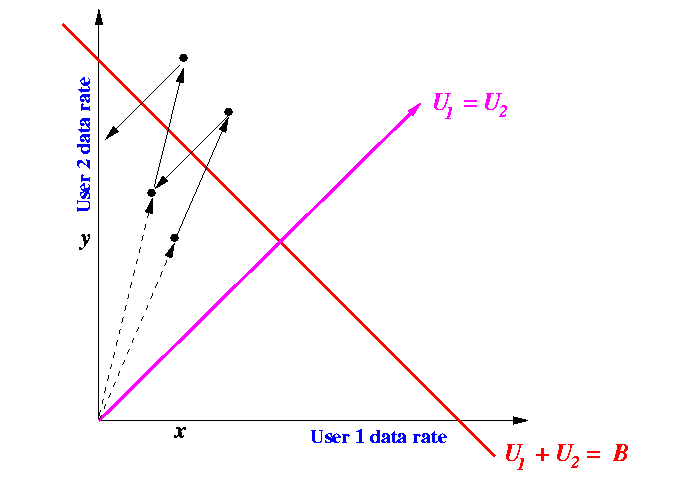
|
- Method diverges away from the ideal point !!!
The following figure shows the effect of the "additive increase and multiplicative decrease" method:
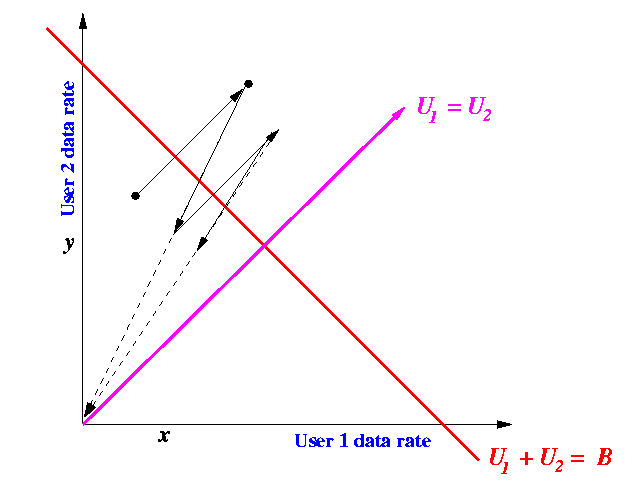
|
- Method moves TOWARDS the ideal point !!!
- The additive increase and multiplicative decrease scheme will move the system towards a stable and fair equilibrium.
- Raj Jain's theory has held up for over 20 years.
- In Raj's days, network speed wehere around 100Kbps, at most 1Mbps
- Things has changed quite a bit, we have networks with speeds
above 1Tbps (1,000,000,000,000 bps).
- In high speed networks,
additive increase is
TOO SLOW
to allow the sender to fully utilize all the network capacity.
- Recent network research is proposing to use
multiplicative increase
and
multiplicative decrease
to control congestion.
The factor used in multiplicative decrease is different (it is larger) than the one used in the multiplicative increase