-
After you
loaded/reloaded
a program into
Egtapi,
you will see a window like this:
-
At the top:
- The Prev. Instr. window contains
the previously executed instruction
- The left box contains the assembler instruction in the program (possibly with a trailing comment)
- The right box contains the actual ARM instruction (some "pseudo" assembler instructions will translate into their real the assembler instruction, e.g.: register fp is actually register r11)
- The Curr. Instr. window contains
the next instruction that
will be executed by the M68000 CPU.
- The left box contains the assembler instruction in the program (possibly with a trailing comment)
- The right box contains the actual ARM instruction (some "pseudo" assembler instructions will translate into their real the assembler instruction, e.g.: register fp is actually register r11)

- The Step button:
- Clicking on the
Step button will
execute
the current instruction
in the assembler program
The program execution will stop after the current instruction except:
- If the instruction is a
bl (= branch and link)
instruction that calls a
library function (= a function that
you did not write),
the Step button will
execute
the entire function
Use the Step Into button button if you want to see the step-wise execution of the instructions of a library function
- If the instruction is a
bl (= branch and link)
instruction that calls a
library function (= a function that
you did not write),
the Step button will
execute
the entire function
- Clicking on the
Step button will
execute
the current instruction
in the assembler program
- The Step Into button:
- Clicking on the
Step Into button will
always execute
the current instruction
in the assembler program
- This button is used to view the execution of
code in library function
Even if the instruction is a bl (= branch and link) instruction that calls a library function (= a function that you did not write), the Step Into button will only execute the next instruction and doing so, will enter the library function.
- Clicking on the
Step Into button will
always execute
the current instruction
in the assembler program
- The Step Out button:
- This button is used after you have used the
Step Inti button
and enter a
library function
Pressing the Step Out button will finish the library function and return to the location in your program where you called the library function .
- This button is used after you have used the
Step Inti button
and enter a
library function
- The Run button:
- Clicking on the
Run button will
run the
program starting at
the current instruction
- The program will
only stop when
the program execution
arrives/reaches
a break point
(For more information on break points, read this EGTAPI section: click here)
Note:
- Every program
in CS255 must contain the
break point
Stop
The break point Stop marks the end of the program execution
- When program execution arrives/reaches the Stop break point, EGTAPI will stop the program from running
- Every program
in CS255 must contain the
break point
Stop
- Clicking on the
Run button will
run the
program starting at
the current instruction
- The Reload button:
- Clicking on the
Reload button will
load the
same program that you are running and start
the execution from the
beginning
This button is handy when you want to run the program again after you have made some changes (bugs ?) and have re-compiled the changed code.
- Clicking on the
Reload button will
load the
same program that you are running and start
the execution from the
beginning

- The Prev. Instr. window contains
the previously executed instruction
-
On the left panel:
- The left panel contains
the register display area:
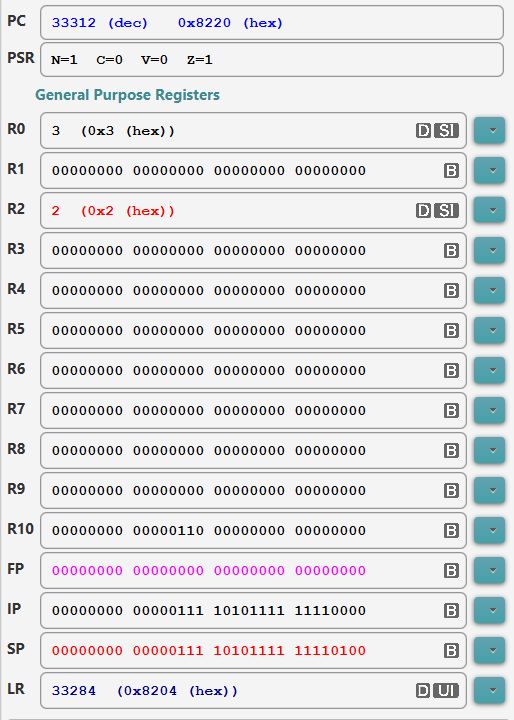
- The values displayed in
this area are
the current values of the
PC
(program counter)
and PSR
(processor status register), the
general purpose registers (R0, R1, ..., R10)
and
the special purpose registers
(FP=frame pointer, SP=stack pointer, LR=link register)
(The register IP is not used in CS255)
The values in the registers and can be displayed in different formats
For details, see click here
- The left panel contains
the register display area:
-
On the center panel:
- The center panel contains
the memory/stack display area
-
The values displayed in
top window in this area are
the (hexadecimal) values in each
memory location used by the
running program
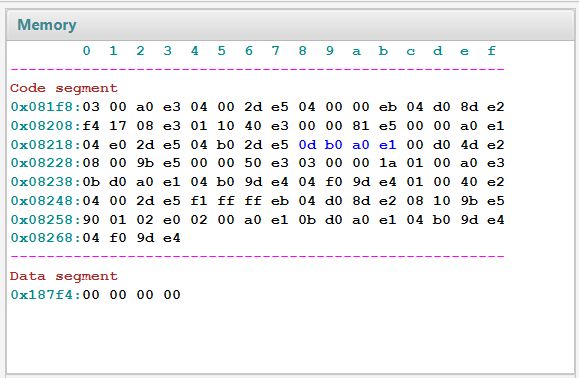
E.g.: in the above display, you can see that the byte value stored in memory address 0x081f8 (= 081f8 hex) is 03 (hex) or 00000011 (binary)
Note:
- The data stored in this
memory area can be one of
the following:
- The binary codes for the assembler instructions of the program stored in the code segment
- The binary codes for the variables used in the program stored in the data segment (defined using the .byte and the .skip assembler directives)
You would normally not need to look at the values in this memory area.
It's displayed to give you a complete picture on what is going on inside a computer program
- The data stored in this
memory area can be one of
the following:
- The values displayed in
bottom window in this area are
the (decimal and hexadecimal) values
in the system stack of the
running program
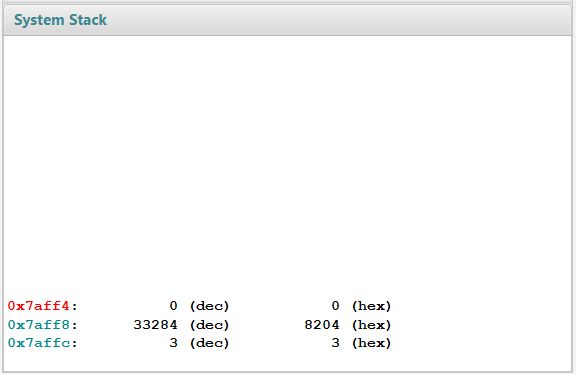
The top of the system stack is the first value (= 0 (dec) or 0 (hex)) displayed in the window
The address of the top in 0x7aff4 or 7aff4 hex
- The center panel contains
the memory/stack display area
-
On the right panel:
- The right panel contains
the variables display area and
the breakpoint display area
- The top window in this
area is the
variables display area:
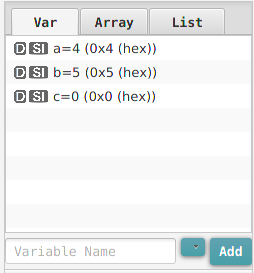
Click on the Var tab to view the simple variables in your program
Click in the Array tab to view the values of the array variables in your program
Click in the List tab to view the values of the list variables in your programYou can add more variables to be displayed; but it's usually not necessary as the professor has provided an EGTAPI debug file for each project that displays the variables in your programs
- You can find out details about a
variable by: right click on the
variable name in the display.
For example: you will see this pop up window when you right click on the variable name a:

The (memory) address of the variable name a is 100260 (dec) or 187a4 (Hex).
You can also remove the variable from the display information using the right click function.
- The right panel contains
the variables display area and
the breakpoint display area
- The bottom window in this
area is the
breakpoint display area:
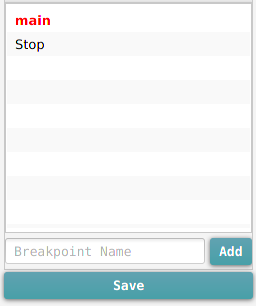
Breakpoint = a location in the program marked by a label where program execution will stop
A label must be defined using .global (= externally definied) in order to be used as a breakpoint
Example:
- In the figure above,
the program has
stopped at the
breakpoint fac
(fac is a label defined in the factorial fac.s program)
- If you look in the
program fac.s,
you will see that the label fac
was defined at the top of
the program as:
.global facYou can add more breakpoint to EGTAPI by:
- Type the name of the
label
(e.g.: MyLable) in the
breakpoint box:
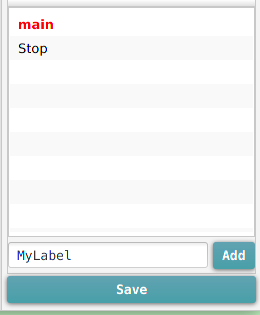
and click on the Add button
The label that you used must be defined as .global in your program !!!
Also: you must compile the program if you have added a new label to your program that you want to use as breakpoint
For more information on breakpoints: click here
- Type the name of the
label
(e.g.: MyLable) in the
breakpoint box:
- In the figure above,
the program has
stopped at the
breakpoint fac
|
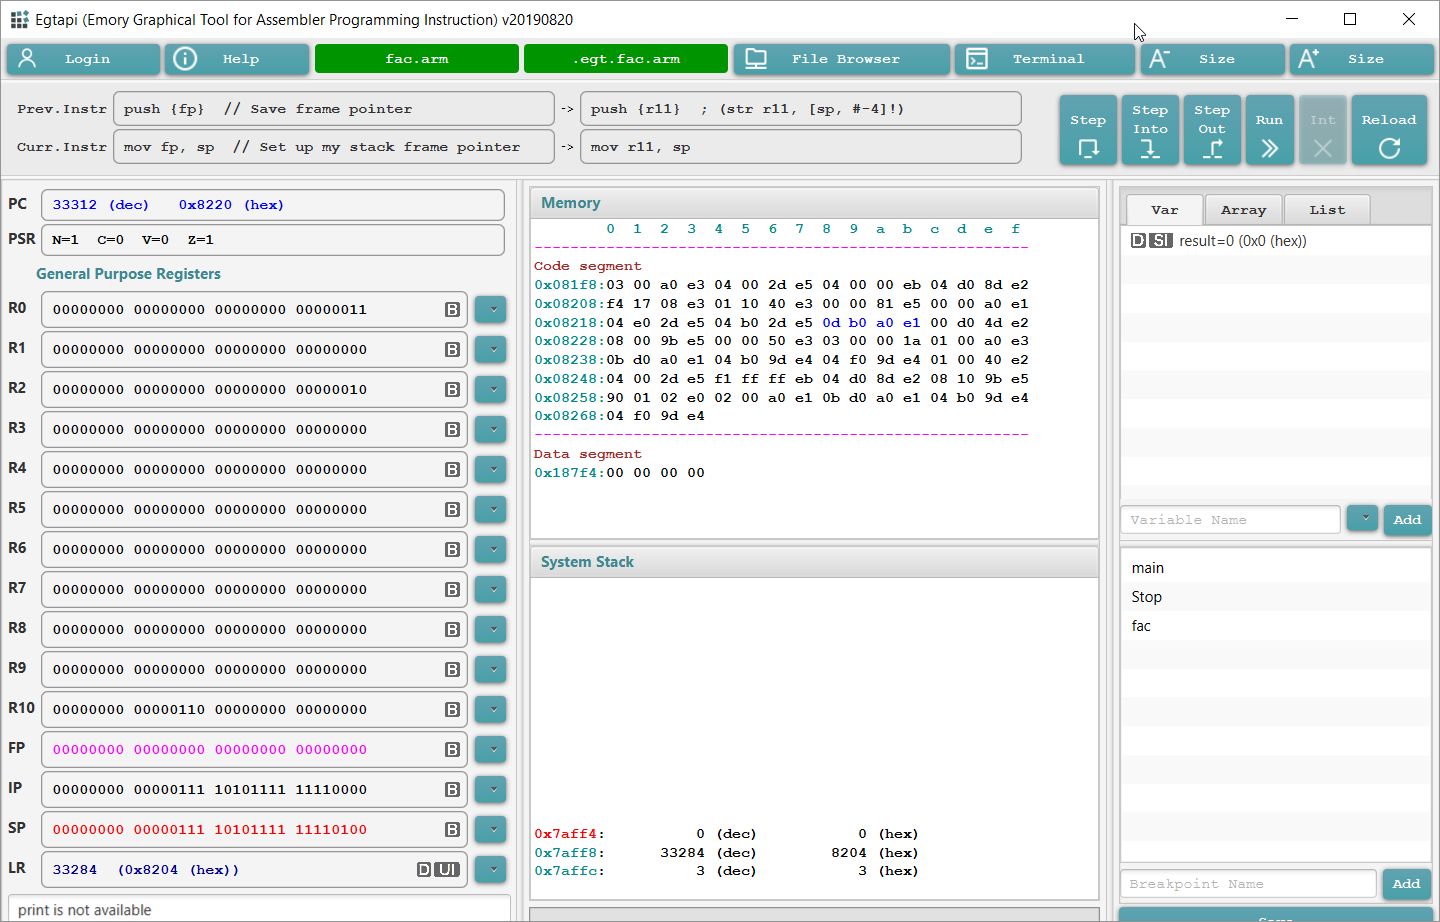
The information displayed in the various areas of the Egtapi display are as follows:
|
|
- Important fact:
- Each time EGTAPI loads or reloads a program, EGTAPI will read in debug information from a startup file
- If you have added
some variables or
breakpoints to
the EGTAPI
display area
and you want EGTAPI to
include the
new information when you
reload the program,
then:
- You must save the new display information into the EGTAPI startup file !!!
- How to save
a new EGTAPI start file:
- Click on the Save button
at the bottom
of the Break point display area:
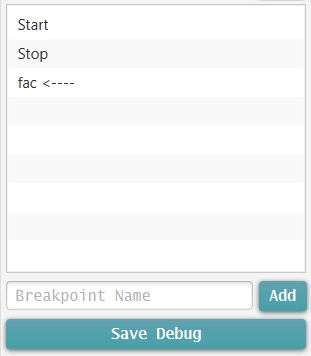
A window will pop up:
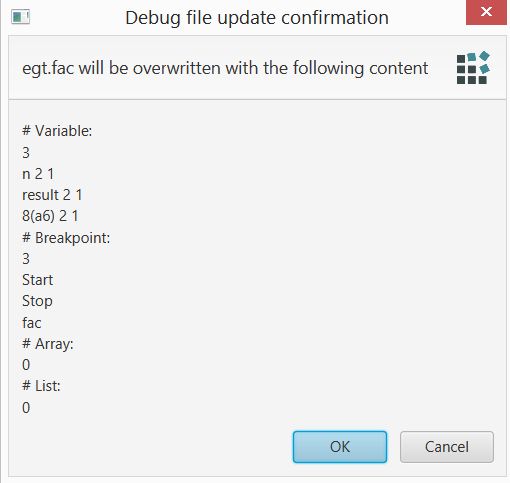
Click OK to save a new EGTAPI debug file for the program
(EGTAPI maintains a debug information file for each program)
- Click on the Save button
at the bottom
of the Break point display area: