Introduction
Event scales are commonly used by practitioners to gauge subjective feelings on the magnitude and significance of social events. For example, the Centers for Disease Control and Prevention (CDC) utilizes a 10-level scale to distinguish the severity of flu outbreaks and governments typically categorize violent outbreaks based on their intensity as reflected in multiple aspects. Effective forecasting of future event scales can be used qualitatively to determine reasonable resource allocations and facilitate accurate proactive actions by practitioners.
More formally, the problem can be formulated as ordinal data prediction problem where the input can be a high-dimensional feature vector while the output is an ordinal-value data.
Processsed Data
Download link: [event_scale]
Data format: See the readme.txt enclosed for details.
Data Source
Input: All the tweet messages that mention their author got flu during early 2011 to late 2014. See the procedure on how these tweets are retrieved in the paper [TKDE].
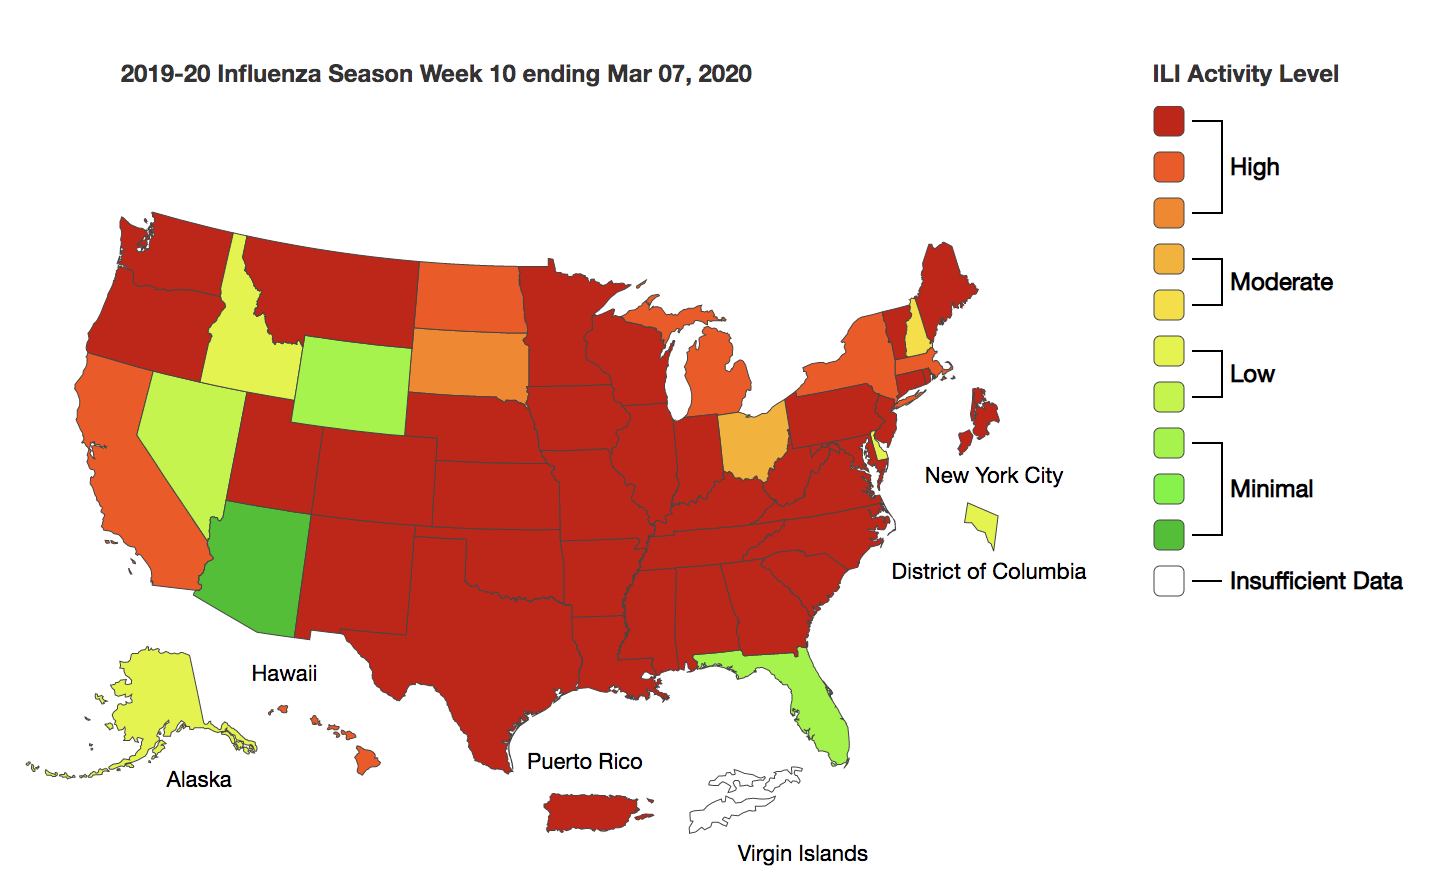
Output: Influenza outbreak during early 2011 to late 2014 report by the government, namely Flu Activity Map from the Center of Disease Control and Internvention. There are 10 levels of flu acivities from minimal to high as shown in the following figure.
Citation
To use these datasets, please cite the papers:
Yuyang Gao and Liang Zhao. Incomplete Label Multi-Task Ordinal Regression for Spatial Event Scale Forecasting. Thirty-Second AAAI Conference on Artificial Intelligence (AAAI 2018), Oral presentation (acceptance rate: 11.0%), New Orleans, US, Feb 2018, pp. 2999-3006, New Orleans, US, Feb 2018.
Acknowledgement

NSF (sole-PI): III: CAREER: Spatial Network Deep Generative Modeling, Transformation, and Interpretation, $549,656, 2020-2025, National Science Foundation.
