Slideshow:
- Statistical data on the
input relations:
- Relation level
statistics:
   R = R(a,b)
   S = S(b,c)

   Statistics on the relations:

           R                    S
     =======================================
       T(R)   = 1000       T(S)   = 500
       V(R,b) = 14         V(S,b) = 13
-
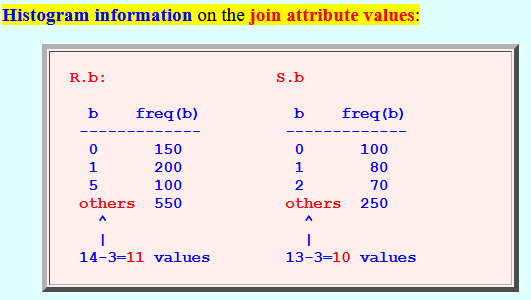
Histogram information on
the join attribute values:
  R.b:                  S.b

    b    freq(b)          b    freq(b)
   -------------	 -------------
    0      150            0      100
    1	   200		  1	  80
    5	   100		  2	  70
   others  550           others  250
     ^                     ^
     |			   |
   14-3=11 values        13-3=10 values
Uniformity assumption:
   R.b:      550 tuples has 11 different values
        <==>  50 tuples per attribute value


   S.b:      250 tuples has 10 different values
        <==>  25 tuples per attribute value
- Relation level
statistics:
- Problem:
- Give an estimate of the size of R(a,b) ⋈ S(b,c)
- Worked out
example:
- Input:
   V(R,b) = 14      T(R) = 1000
   V(S,b0 = 13      T(S) = 500

   R.b = 0(150)  1(200)  5(100)    + 11 other values(50 each)
   S.b = 0(100)  1(80)   2(70)     + 10 other values(25 each)
- Applying the
containment of
value sets
assumption, we have:
   V(R,b) = 14      T(R) = 1000
   V(S,b0 = 13      T(S) = 500

   R.b = 0(150)  1(200)  2(50)  5(100)    + 10 other values(50 each)
   S.b = 0(100)  1(80)   2(70)  5(25)     +  9 other values(25 each)
Therefore the join result of the value b = 0, 1, 2, 5 are:
   V(R,b) = 14      T(R) = 1000
   V(S,b0 = 13      T(S) = 500

   R.b = 0(150)  1(200)  2(50)  5(100)    + 10 other values(50 each)
   S.b = 0(100)  1(80)   2(70)  5(25)     +  9 other values(25 each)
           |       |       |      |
           V       V       V      V
         15,000   16,000  3,500  2,500  tuples
       (=150×100)
- Computing the
join result for
the "other" values:
   We continue to make the containment of value set assumption

   Because:

       V(S,b) ≤ V(R,b)  ===>  all values of S.b are assumed to be in R.b


   Therefore:

      R.b = { 0, 1, 2, 5, + 10 other values (50 tuples each) }
      S.b = { 0, 1, 2, 5, +  9 other values (25 tuples each) }

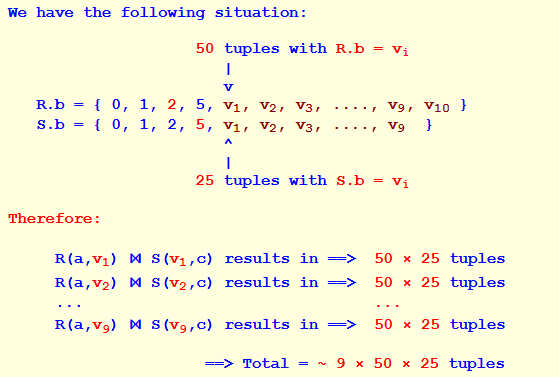
   We have the following situation:

                       50 tuples with R.b = vi
                          |
                          v
      R.b = { 0, 1, 2, 5, v1, v2, v3, ...., v9, v10 }
      S.b = { 0, 1, 2, 5, v1, v2, v3, ...., v9  }
                          ^
			  |
                       25 tuples with S.b = vi

   Therefore:

        R(a,v1) ⋈ S(v1,c) results in ==>  50 × 25 tuples
        R(a,v2) ⋈ S(v2,c) results in ==>  50 × 25 tuples
        ...                               ...
        R(a,v9) ⋈ S(v9,c) results in ==>  50 × 25 tuples

                        ==> Total = ~ 9 × 50 × 25 tuples
- Therefore:
   T(R⋈S)  ~=  15,000 + 16,000 + 2,500 + 3,500 + 9×50×25
           ~=  48,250 tuples
- Input:
- Compare: estimate
without using
histogram information
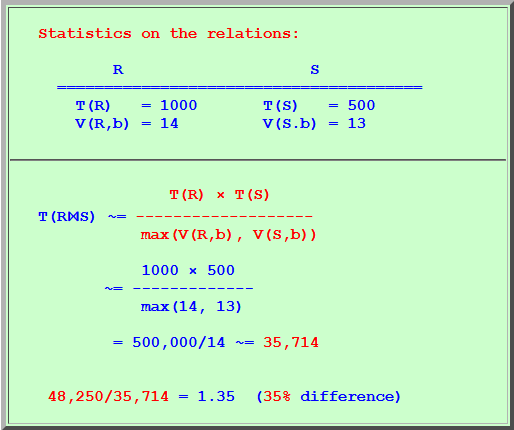
   Statistics on the relations:

           R                    S
     =======================================
       T(R)   = 1000       T(S)   = 500
       V(R,b) = 14         V(S.b) = 13


                 T(R) × T(S)
   T(R⋈S) ~= -------------------
              max(V(R,b), V(S,b))

              1000 × 500
          ~= -------------
              max(14, 13)

           = 500,000/14 ~= 35,714


    48,250/35,714 = 1.35  (35% difference)


