- We have seen a high level discription
of the
TCP Congestion control algorithm
consisting of 2 different phase:
- In the slow start phase,
TCP's transmission rate
doubles after each epoch
- thus increases exponentially in time.
- In the congestion avoidance phase, TCP's transmission rate increases linearly after each epoch - this increases linearly in time.
- In the slow start phase,
TCP's transmission rate
doubles after each epoch
- thus increases exponentially in time.
- In this webpage, we will
study
how
the increase in transmission speed
is implemented
- Techniques used to implement
TCP congestion control algorithm
(has very sexy sounding names):
- Slow Start
- Fast Retransmit
- Fast Recovery
We will look at each mechanism separately and indicated when the mechanism is appropriate.
The SLOW START Phase
- During the slow start phase,
TCP uses the
slow start mechanism
for congestion control.
- Information needed to implement the
slow start mechanism:
- SSThresHold
=
The window size
that TCP believes
to be safe to use
- SSThresHold = AWS when TCP begins for the first time
- SSThresHold = CWND/2 when TCP detects a packet loss
- CWND
=
The (current) Congestion window size
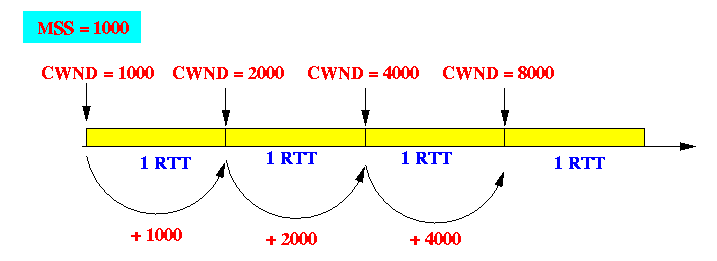
In the slow start phase, the CWND will increase as follows:
- CWND(t+1) = 2 × CWND(t) when no congestion (packet drop) has been detected in an epoch
Graphically:
- SSThresHold
=
The window size
that TCP believes
to be safe to use
- Implementing the
slow start mechanism:
-
Initilization:
(when TCP
first starts transmitting)
- SSThresHold = AWS
- Slow Start procedure:
- Set
CWND = MSS
(i.e., one packet)
- Whenever TCP
receives an
new ACK packet,
then
increases CWND by
MSS
- Note:
- A new ACK message
is an ACK that
has a higher ACK number than
the receive sequence number
- If TCP receives a duplicate ACK (i.e., an ACK message that has a ACK number that is less or equal to the receive sequence number) the CWND variable is unchanged !
- A new ACK message
is an ACK that
has a higher ACK number than
the receive sequence number
- Set
CWND = MSS
(i.e., one packet)
-
Initilization:
(when TCP
first starts transmitting)
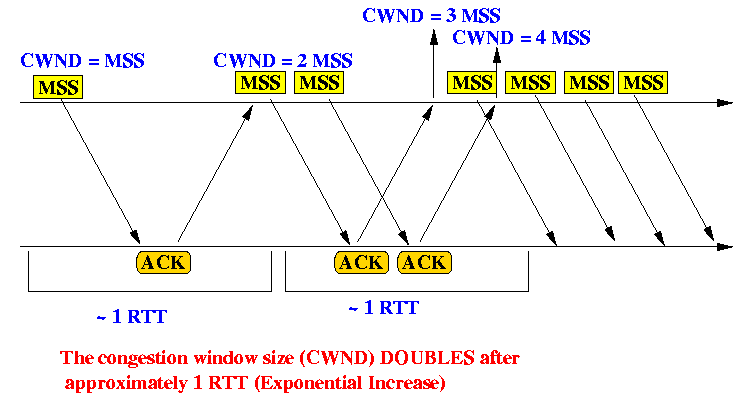
- Example of TCP operation in the slow start phase:
Notes:
- Initially (at time 0), CWND = 1
- At time RTT (round trip time),
CWND = 2
- At time 2 RTT,
CWND = 4
- At time 3 RTT (not in figure),
CWND = 8
- And so on...
- When you plot CWND
over time, CWND
will
double after
each RTT time
(Therefore, the epoch that is RTT seconds !!!)
When plotted out, the CWND increases exponentially with time
- Initially (at time 0), CWND = 1
- The slow start procedure
is used
in the following 2 stituations:
- When a TCP connection is
first establish (first start transmitting).
- In this case, SSThresHold is set to (equal to) AWS
- When TCP has
detected a
packet loss
- In this case, SSThresHold
will be set to
CWND/2
(this is done by the congestion avoidance algorithm prior to entering in the slow start process)
- In this case, SSThresHold
will be set to
CWND/2
- When a TCP connection is
first establish (first start transmitting).
- The slow start epoch can
ended
by 2 events:
- Ended normally
when CWND becomes > SSThresh
- In this case, TCP will enter the
congestion control
phase:

- TCP is now in "uncharted" territory and will increase its congestion window slower when no congested is detected
- In this case, TCP will enter the
congestion control
phase:
- Ended abnormally
if TCP detects a packet loss
during the slow start phase
- In this case, TCP will:
- TCP first sets
SSThresh = CNWD/2
(CWND is the transmit window size that TCP was using at the time that the packet loss was detected)
- Then TCP
re-start
the slow start procedure
I.e., set CWND = 1 and increase CWND by 1 for every new ACK
- TCP first sets
SSThresh = CNWD/2
- In this case, TCP will:
- Ended normally
when CWND becomes > SSThresh
- Question:
- Why would TCP use a
complicated "slow start"
procedure to increase
CWND
from ONE all the way to
SSThrehHold
Why not just set CWND = SSThresh and be done with it ???
- Why would TCP use a
complicated "slow start"
procedure to increase
CWND
from ONE all the way to
SSThrehHold
- Answer:
- TCP does this to
obtain an accurate
estimate for
the Round Trip Time (RTT)
- TCP uses timeouts to
tell if it needs to
retransmit packets
- The timeout value used depends on the RTT of packets
- By sending packets at a exponentially increasing rate instead of in a single burst, TCP can obtain a more accurate meaure for the RTT of packets
- TCP does this to
obtain an accurate
estimate for
the Round Trip Time (RTT)
- The name "slow start" is
probably one of the
worst misnomer
in networking..
- How on earth can you call an exponential increase in window size in each epoch SLOW ???
- It's slow compared to
what TCP was doing
before they changed it...
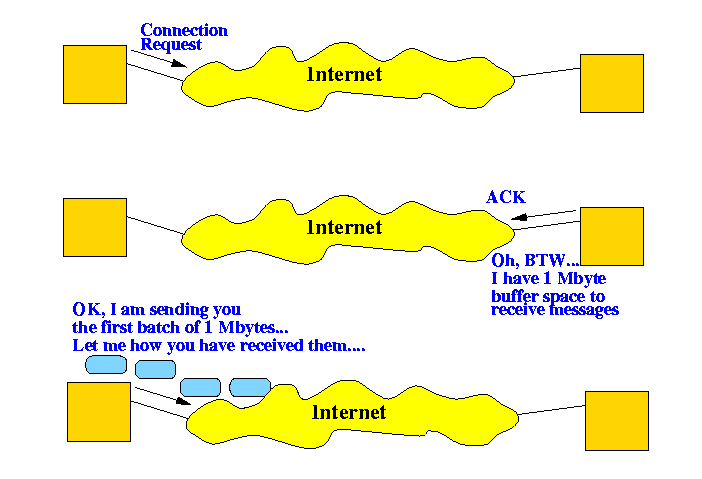
- Prior to Jacobson's work,
TCP operates as follows:
- Notes:
- A new TCP connection
first negotiate a
advertised window size (AWS)
- The source immediately transmits an amount of data that is equal to the advertised window size (e.g., when a large file is transfered).
- A new TCP connection
first negotiate a
advertised window size (AWS)
- Now, compared to sending AWS bytes of data, the new way of start transmitting ONE packet first is indeeds slower...
The Congestion Avoidance Phase
- TCP enters the
congestion avoidance phase
when the
slow start phase
terminates
normally
(i.e., CWND > SSThresHold)
- Goal of the
congestion avoidance phase:
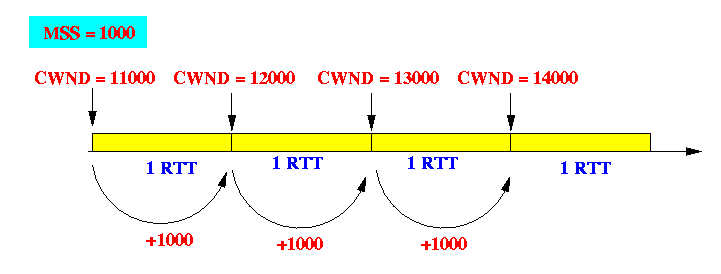
- Goal::
- TCP increases CWND by one packet (= MSS bytes) when no packet drops have been detected for RTT sec (one epoch)
Graphically:
Problem:
- It difficult to
constantly monitor packet drops
for a given period of time
It is easier by far to increase CWND each time you receive a new ACK message
- Notice that if TCP is transmitting maximum size packets,
and the congestion window is
CWND,
then there are approximately
CWND/MSS packets sent using
the transmit window
- Goal::
- Practical implementation of the linear increase method:
- We want to
increase CWND by
approximately MSS
in
RTT second
Fact:
- The are
approximately
CWND/MSS packets
in transition towards the
receiver
- If no packets are dropped, the sender will receive approximately CWND/MSS new acknowledgements
- The are
approximately
CWND/MSS packets
in transition towards the
receiver
- Suppose we
increase CWND
by x
each time we receive a new ACK
Then after RTT sec (or CWND/MSS acks), the new value of CWND will be:
- CWND + (CWND/MSS × x)
If we want CWND to increase by MSS in RTT sec (or CWND/MSS acks), then we must use:
        CWND + (CWND/MSS  *  x) = CWND + MSS

  <==>  (CWND/MSS  *  x) = MSS


               MSS * MSS
  <==>  x = ---------------
                  CWND
- Conclusion:
- If we want to increase CWND by MSS in RTT time, we can approximately achives this by increasing CWND by MSS2/CWND each time TCP receives a new acknowledgement
Example of TCP operation in the congestion avoidance phase: using CWND = 4 × MSS
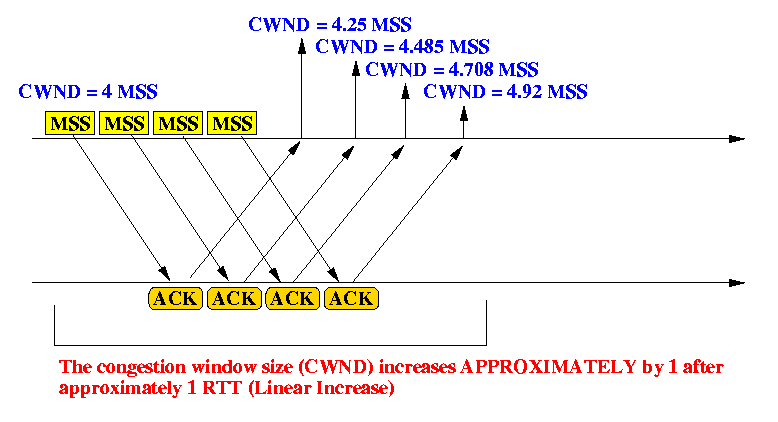
Notes:
-
TCP has sent out
4 packets
(each containing MSS bytes) to the
receiver.
If there is no congestion (no packet drops), the sender will receive 4 new ACK packets in approximately RTT time
- When the first ACK packet
is received, TCP updates
CWND as follows:
CWND = CWND + MSS * MSS/CWND // CWND = 4 MSS = 4 MSS + MSS * MSS/(4 MSS) = 4 MSS + MSS * 1/4 = 4.25 MSS - When the second ACK packet
is received, TCP updates
CWND as follows:
CWND = CWND + MSS * MSS/CWND // CWND = 4.25 MSS = 4.25 MSS + MSS * MSS/(4.25 MSS) = 4.25 MSS + MSS * 1/4.25 = 4.485 MSS - When the third ACK packet
is received, TCP updates
CWND as follows:
CWND = CWND + MSS * MSS/CWND // CWND = 4.485 MSS = 4.485 MSS + MSS * MSS/(4.485 MSS) = 4.485 MSS + MSS * 1/4.485 = 4.708 MSS - Finally, when the fourth (and final)
ACK packet
is received, TCP updates
CWND as follows:
  CWND = CWND + MSS * MSS/CWND        // CWND = 4.708 MSS
       = 4.708 MSS + MSS * MSS/(4.708 MSS)
       = 4.708 MSS + MSS * 1/4.708

       = 4.92 MSS
- Conclusion:
- The value of CWND
is
increased by 0.92 × MSS
(We want to increase CWND by exactly MSS - this is pretty good !!!)
- The value of CWND
is
increased by 0.92 × MSS
- We want to
increase CWND by
approximately MSS
in
RTT second
- NOTE:
the actual implementation of TCP (see Stevens - Volume 2)
increases CWND during congestion avoidance
slightly faster than above using to the following formula:
CWND = CWND + MSS * MSS/CWND + MSS/8
- TCP starts to use Congestion Avoidance:
- When TCP
has successfully
completed the
Slow Start phase
I.e.: when CWND ≥ SSThresh
- When TCP
has successfully
completed the
Slow Start phase
- TCP stop to use Congestion Avoidance:
- When TCP
detects
a packet loss event
(TCP times out waiting for an ACK)
A packet drop means congestion
- When TCP
detects
a packet loss event
- When TCP times out:
- Set: SSThresh = CWND/2
- Enter the slow start phase
Example:
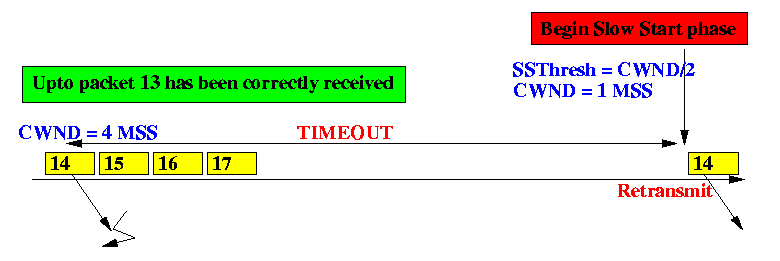
Notes:
- The sender has
CWND = 4 × MSS
Suppose packet 14 is lost
- The ACK message for
packet 14 will
not be received
and the sender will
time out
- Result of the time out:
- TCP sets
SSThresh = CWND/2
= 2 × MSS.
(This is the new "safe" operation level)...
- Then TCP enters the
slow start procedure:
- Set
CWND = 1 x MSS
(i.e., 1 packet worth of data)
and
- increases CWND at an expontial rate towards SSThresh (the "safe" level")
- Set
CWND = 1 x MSS
(i.e., 1 packet worth of data)
and
- TCP sets
SSThresh = CWND/2
= 2 × MSS.
- Set: SSThresh = CWND/2
- The standard Go-Back-N
method uses
timeout
to trigger
retransmission
Example:
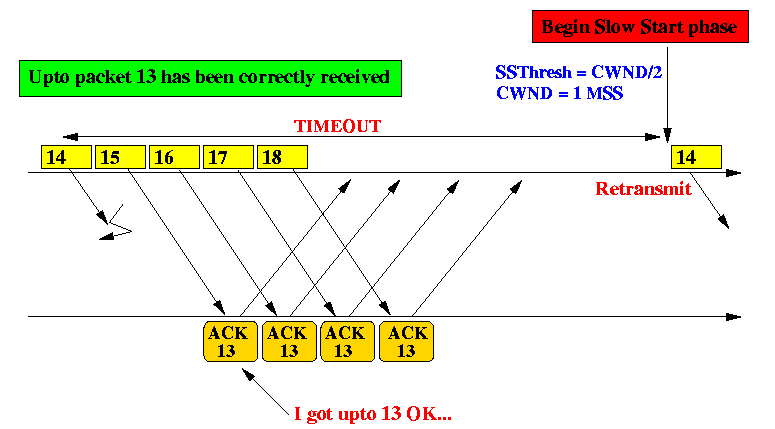
Note:
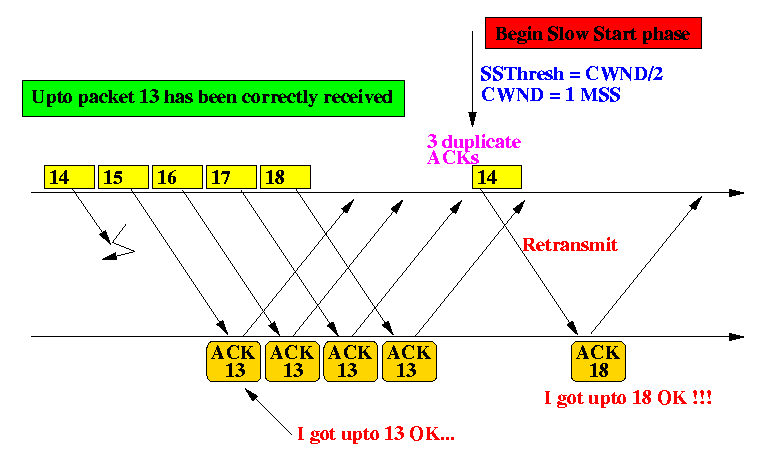
- All packets upto
packet 13
have been received and acknowledged
- When packet 14
is lossed, and
packets #15, #16, #17 and #18
arrive
out of order at the receiver
The receiver will send back one ACK 13 for each received packet (to indicate that the last consecutive packet received was #13)
- All packets upto
packet 13
have been received and acknowledged
- Packet loss detection:
- The packet loss
in standard Go-back-N is
through time out
- Therefore:
- When the sender times out and retransmits the packet, the sender will begin a slow start phase
- The packet loss
in standard Go-back-N is
through time out
- Notice that when a packet is dropped,
the packets that follow
the dropped packet will
trigger
duplicate ACK messages
from the receiver:

Note:
- We see 4 duplicate ACKs in the above example
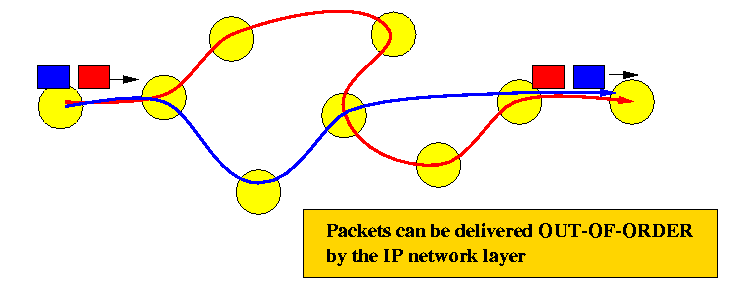
- Caveat:
not every
duplicate ACK
is the result of packet loss
Example: packets that arrive out of order can result in duplicate ACK can arrive:
Avoid misinterpretating duplicate ACK as packet loss:
- To eliminate
false loss indications
from duplicate ACK,
TCP will
conclude packet loss
only after receive
3 duplicate ACKs
(so TCP received a total of 4 identical ACK packets),
- To eliminate
false loss indications
from duplicate ACK,
TCP will
conclude packet loss
only after receive
3 duplicate ACKs
- Improved packet loss detection mechanism:
Note:
- After receiving 3 duplicate ACKs,
TCP concludes that a
packet has been lossed
- TCP
retransmits
the
lossed packet immediately
without waiting for timeout !!!
- This retransmission technique
is called
fast retransmit
(It retransmits a loss packet faster than using time out)
- This retransmission technique
is called
fast retransmit
- Furthermore, TCP will enter the Slow Start phase (because a packet loss had occured)
- After receiving 3 duplicate ACKs,
TCP concludes that a
packet has been lossed
- The TCP algorithm
that uses:
- Slow start
- Congestion avoidance
- Fast Retransmit
is known as TCP Tahoe
- TCP Tahoe
(the original version by Jacobson)
incorporates the Slow Start and Congestion Avoidance
mechanisms.
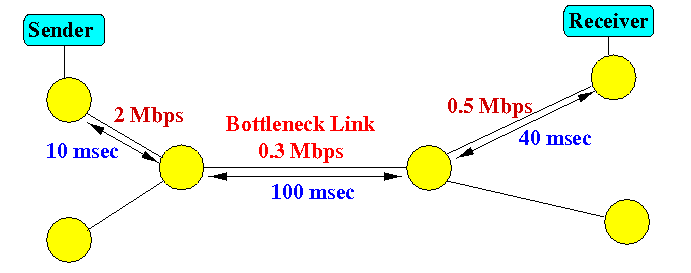
- We will look at the operation of TCP Tahoe in this sample network:
- Example Program:
(Simulates the above network in NS)

- Here is a NS2 source file to simulate a TCP Tahoe source:
click here
- Right click and save the file in your directory.
- Run program with:
/home/cs455000/bin/ns Tahoe.tcl - You should see the Network Animator window when it finish running... click PLAY to see the simulation in action
- You don't need to run the simulation to see the animation...
I have saved a copy of the animation file generated by the simulation.
The NAM (Network Animation) output file is here: click here
-
To see the animation, save the NAM file in your directory and
use this command:
/home/cs455000/bin/nam Tahoe.nam
- The Congestion Window CWND plot data output file is here:
click here
-
To see the plot of the CWND of TCP,
save the Congestion Window CWND plot file in your directory and
run gnuplot
In gnuplot, issue the command:
plot "WinFile" using 1:2 title "Flow 1" with lines 1You should see this plot:
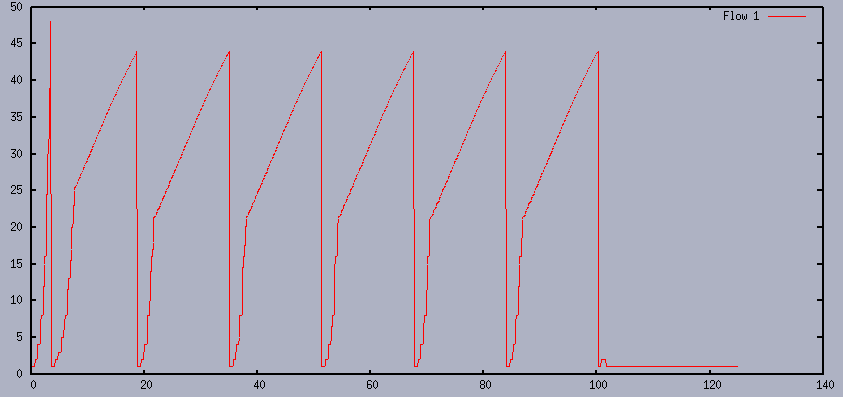
You can see the operation of TCP Tahoe clearly from the above figure:
- At approximately time 0, TCP Tahoe
starts and it is in the slow start mode:
the congestion window size increases exponentially
- At approximately time 5, packet loss is detected.
TCP marks SSThresh = 25 (approximately) and begins another slow start
- When it reaches CWND = 25 (approximately),
the CWND increases linearly - here TCP Tahoe enters
the congestion avoidance mode
- At approximately time 19, TCP Tahoe detects packet loss and
begins a slow start.
SSThresHold is approximately 22.
- TCP begins another slow start and so on...
- At approximately time 0, TCP Tahoe
starts and it is in the slow start mode:
the congestion window size increases exponentially
- Here is a NS2 source file to simulate a TCP Tahoe source:
click here