- Fact from Mathematics:
- Any periodic function
can be written as a
infinite sum
of
sin() and
cos()
functions.
- The infinite sum of sin() and cos() is the well-known Fourier series
See: click here
- Any periodic function
can be written as a
infinite sum
of
sin() and
cos()
functions.
- Example:
- Function:
(representing a (periodic)
digital signal)
- The Fourier series for
the block wave above is:
          2              2              2               2
   0.5 + --- sin(2πt) + --- sin(6πt) + --- sin(10πt) + --- sin(14πt) + ...
          π              3π             5π              7π
- Function:
(representing a (periodic)
digital signal)
- Let us study the
effect of
using a portion of
the sum:
2 0.5 + --- sin(2πt) π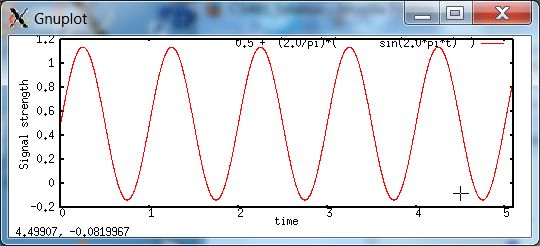
2 2 0.5 + --- sin(2πt) + --- sin(6πt) π 3π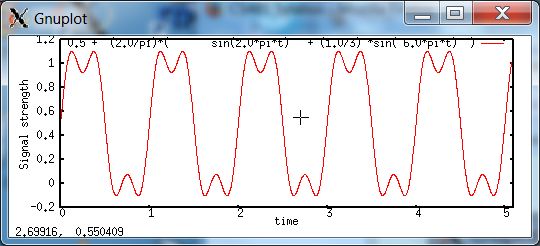
2 2 2 2 0.5 + --- sin(2πt) + --- sin(6πt) + --- sin(10πt) + --- sin(14πt) + ... π 3π 5π 7π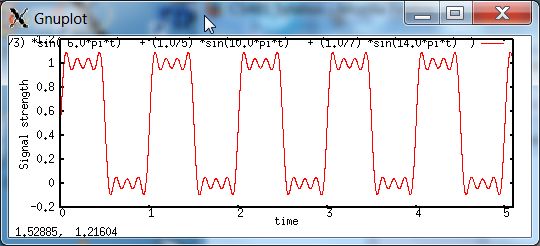
Upto and including sin(50πt):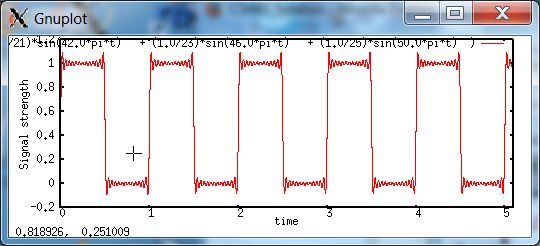
- The following is an input file for gnuplot used to make the
plots:
set xlabel "time" set samples 4000 show xlabel set ylabel "Signal strength" show ylabel plot [t=0:5.1] [-0.2:1.2] \ 0.5 + \ (2.0/pi)*( \ sin(2.0*pi*t) \ + (1.0/3) *sin( 6.0*pi*t) \ + (1.0/5) *sin(10.0*pi*t) \ + (1.0/7) *sin(14.0*pi*t) \ + (1.0/9) *sin(18.0*pi*t) \ + (1.0/11)*sin(22.0*pi*t) \ + (1.0/13)*sin(26.0*pi*t) \ + (1.0/15)*sin(30.0*pi*t) \ + (1.0/17)*sin(34.0*pi*t) \ + (1.0/19)*sin(38.0*pi*t) \ + (1.0/21)*sin(42.0*pi*t) \ + (1.0/23)*sin(46.0*pi*t) \ + (1.0/25)*sin(50.0*pi*t) \ ) - To use it, do:
- Cut and paste the function into a file name "x"
- Run gnuplot
- and issue the command load "x" to see the plot.
Try removing some higher frequencies (edit the file and reload) and see how the plot changes....
- What we see in the above
example:
- A digital signal
that fluctuates at a
frequency fb = 1 Hz:
is composed of a spectrum of frequencies:
fb = 1 Hz: (2/π) sin(2πt)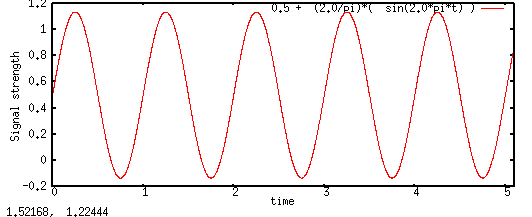
3fb = 3 Hz: (2/3π) sin(6πt)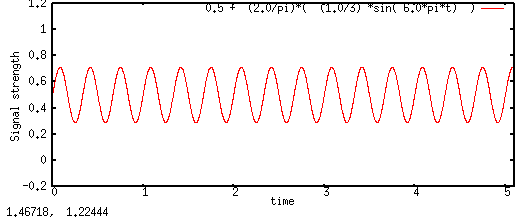
5fb = 5 Hz: (2/5π) sin(10πt)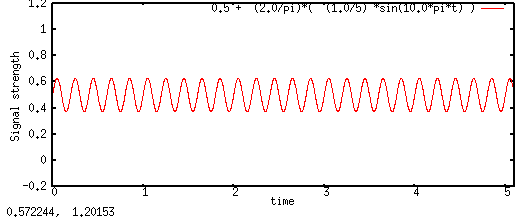 And so on !!!
Note:
- The frequency
of a sine function
is found in the
coefficient
inside the sin()
- The amplitude of
the sine wave is the
coefficient
in front
of the sin/cos
function
Example:
   (2/5π) sin(10πt)
     ^         ^
     |	       |
   Amplitude  Frequency (ω = 10π = 5×(2π) ==> freq = 5)
- A digital signal
that fluctuates at a
frequency fb = 1 Hz:
- The lower frequency
sine waves
are terms with a
smaller coefficient, e.g.:
- sin(1πt), sin(2πt), sin(3πt), ....
- The higher frequency sine waves
are terms with
larger coefficients, like:
- sin(10πt), sin(11πt), sin(12πt), ...
-
Notice that:
- The higher the frequency,
the smaller the amplitude
of the sine wave:
fb = 1 Hz: (2/π) sin(2πt)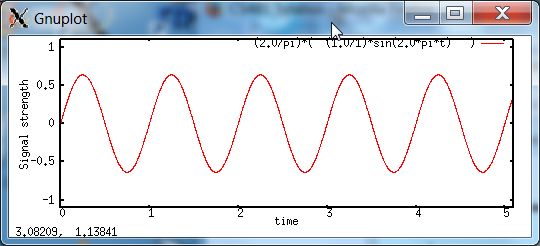
3fb = 3 Hz: (2/3π) sin(6πt)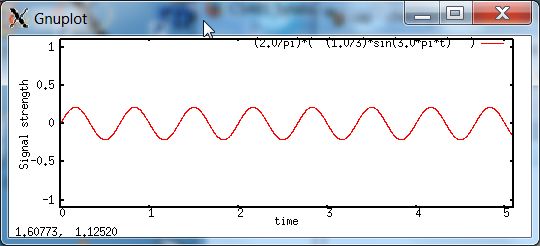
5fb = 5 Hz: (2/5π) sin(10πt)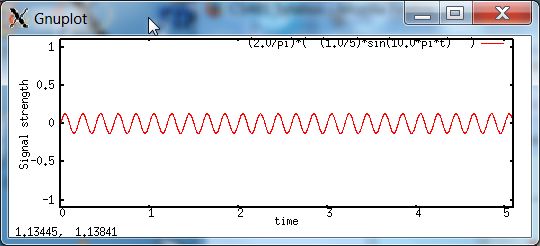 And so on !!!
- The higher the frequency,
the smaller the amplitude
of the sine wave:
- That means:
- Higher frequency terms are getting less and less important, because they add less to the total of the sum !!!
- Conclusion:
- The lower frequency term
are necessary to
obtain the
base form
of the signal
- However, the base form alone is not adequate to construct the original signal reliably (you can see the plot with a small number of terms)
- Some
higher frequency terms
are neccesary,
to obtain an
accurate approximate
the original signal
- The lower frequency term
are necessary to
obtain the
base form
of the signal